Wood Moisture by State: Outdoor EMC for Woodworkers
How wet outdoor wood gets in your area, month by month, and what that means for buying lumber, glue-ups, decks and finishes.
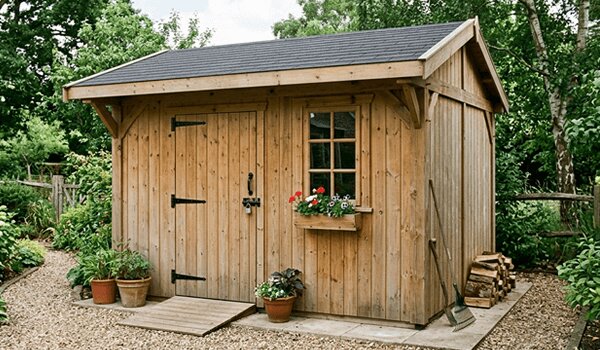
Wood is never really "dry". It takes on and gives off moisture until it balances with the air around it, at a level called the equilibrium moisture content (EMC). That level depends on humidity and temperature, so it changes with the seasons and from one part of the country to another. When wood moves from one level to another it swells or shrinks across its width, which is why decks open up, tabletops crack and doors stick.
The USDA Forest Products Laboratory has calculated the average monthly EMC of wood kept outdoors (under cover, out of rain and sun) for weather stations across the United States, from at least 30 years of NOAA weather records. We built one page per state from those tables, covering 254 places in all 50 states and Washington, D.C. Each page shows the month-by-month numbers for every city, a short section on each city's climate, the moisture content to aim for, how much a deck board moves and the best months for outdoor builds.
How to use these numbers
- For outdoor projects, aim to build with wood close to your area's year-round average.
- For indoor furniture, the target is drier: about 8% for most of the country (6% in the dry Southwest, 11% on the damp, warm coasts), per the Wood Handbook.
- Lumber stamped dry can hold up to 19% moisture. Let it acclimate before you build.
- Plan staining and painting for your area's drier months.
All states at a glance
| State | City | Low | High | Avg | Places |
|---|---|---|---|---|---|
| Alabama | Mobile | 13.0% | 14.4% | 13.6% | 4 |
| Alaska | Juneau | 13.6% | 18.1% | 16.0% | 11 |
| Arizona | Phoenix | 4.6% | 9.5% | 7.2% | 5 |
| Arkansas | Little Rock | 12.8% | 13.9% | 13.4% | 2 |
| California | Los Angeles | 12.1% | 15.1% | 13.7% | 16 |
| Colorado | Denver | 9.4% | 11.0% | 10.1% | 5 |
| Connecticut | Hartford | 10.8% | 13.3% | 12.1% | 2 |
| Delaware | Wilmington | 11.5% | 13.2% | 12.5% | 1 |
| Florida | Miami | 12.3% | 14.5% | 13.5% | 13 |
| Georgia | Atlanta | 11.8% | 14.2% | 13.0% | 7 |
| Hawaii | Honolulu | 10.6% | 13.3% | 11.6% | 4 |
| Idaho | Boise | 7.3% | 15.2% | 10.8% | 3 |
| Illinois | Chicago | 12.2% | 14.9% | 13.3% | 6 |
| Indiana | Indianapolis | 12.8% | 15.7% | 14.1% | 4 |
| Iowa | Des Moines | 12.4% | 14.9% | 13.4% | 4 |
| Kansas | Wichita | 11.5% | 13.9% | 12.8% | 5 |
| Kentucky | Louisville | 12.0% | 14.1% | 13.3% | 5 |
| Louisiana | New Orleans | 14.0% | 15.3% | 14.5% | 5 |
| Maine | Portland | 12.1% | 14.0% | 13.2% | 2 |
| Maryland | Baltimore | 11.3% | 13.1% | 12.3% | 1 |
| Massachusetts | Boston | 11.6% | 13.1% | 12.2% | 3 |
| Michigan | Detroit | 12.3% | 15.1% | 13.5% | 9 |
| Minnesota | Minneapolis-St. Paul | 11.9% | 14.6% | 13.2% | 5 |
| Mississippi | Jackson | 13.7% | 15.1% | 14.3% | 3 |
| Missouri | St. Louis | 12.4% | 14.9% | 13.5% | 4 |
| Montana | Missoula | 9.8% | 17.6% | 13.1% | 8 |
| Nebraska | Omaha | 12.1% | 14.8% | 13.4% | 7 |
| Nevada | Las Vegas | 4.0% | 8.5% | 6.2% | 5 |
| New Hampshire | Concord | 11.4% | 13.9% | 12.8% | 2 |
| New Jersey | Newark | 10.6% | 12.6% | 11.8% | 2 |
| New Mexico | Albuquerque | 6.4% | 10.7% | 8.5% | 3 |
| New York | New York | 11.0% | 12.6% | 12.0% | 7 |
| North Carolina | Raleigh | 11.7% | 14.5% | 13.1% | 6 |
| North Dakota | Fargo | 11.9% | 15.2% | 13.8% | 3 |
| Ohio | Cleveland | 12.6% | 14.6% | 13.5% | 8 |
| Oklahoma | Oklahoma City | 11.7% | 13.4% | 12.6% | 2 |
| Oregon | Portland | 11.7% | 17.4% | 14.2% | 7 |
| Pennsylvania | Philadelphia | 11.2% | 13.0% | 12.2% | 7 |
| Rhode Island | Providence | 11.1% | 13.0% | 12.2% | 1 |
| South Carolina | Charleston | 12.4% | 14.6% | 13.4% | 3 |
| South Dakota | Sioux Falls | 12.6% | 15.3% | 13.6% | 4 |
| Tennessee | Memphis | 12.2% | 13.8% | 12.9% | 5 |
| Texas | Dallas-Ft. Worth | 11.6% | 13.9% | 12.9% | 17 |
| Utah | Salt Lake City | 7.1% | 14.9% | 10.6% | 3 |
| Vermont | Burlington | 11.7% | 14.2% | 13.0% | 1 |
| Virginia | Richmond | 11.3% | 13.8% | 12.8% | 5 |
| Washington | Seattle-Tacoma | 12.2% | 16.5% | 14.3% | 5 |
| Washington, D.C. | Washington | 11.1% | 12.6% | 11.9% | 1 |
| West Virginia | Charleston | 11.4% | 14.3% | 13.2% | 5 |
| Wisconsin | Madison | 12.5% | 15.7% | 14.1% | 4 |
| Wyoming | Cheyenne | 9.7% | 10.8% | 10.3% | 4 |
Every city in the data
Find the station nearest you, or the one with the most similar climate. Each link goes straight to that city on its state page.
- Alabama: Birmingham, Huntsville, Mobile, Montgomery
- Alaska: Anchorage, Barrow (Utqiagvik), Bethel, Fairbanks, Homer, Juneau, King Salmon, Kodiak, Nome, Valdez, Yakutat
- Arizona: Flagstaff, Phoenix, Tucson, Winslow, Yuma
- Arkansas: Fort Smith, Little Rock
- California: Bakersfield, Bishop, Fresno, Long Beach, Los Angeles, Oakland, Red Bluff, Redding, Sacramento, San Diego, San Francisco, Sandberg, Santa Barbara, Santa Maria, Stockton, Twentynine Palms
- Colorado: Alamosa, Colorado Springs, Denver, Grand Junction, Pueblo
- Connecticut: Bridgeport, Hartford
- Delaware: Wilmington
- Florida: Apalachicola, Daytona Beach, Fort Myers, Gainesville, Jacksonville, Key West, Miami, Orlando, Pensacola, Tallahassee, Tampa, Vero Beach, West Palm Beach
- Georgia: Athens, Atlanta, Augusta, Columbus, Macon, Rome, Savannah
- Hawaii: Hilo, Honolulu, Kahului, Lihue
- Idaho: Boise, Lewiston, Pocatello
- Illinois: Cairo, Chicago, Moline, Peoria, Rockford, Springfield
- Indiana: Evansville, Fort Wayne, Indianapolis, South Bend
- Iowa: Des Moines, Dubuque, Sioux City, Waterloo
- Kansas: Concordia, Dodge City, Goodland, Topeka, Wichita
- Kentucky: Covington, Jackson, Lexington, Louisville, Paducah
- Louisiana: Alexandria, Baton Rouge, Lake Charles, New Orleans, Shreveport
- Maine: Caribou, Portland
- Maryland: Baltimore
- Massachusetts: Blue Hill, Boston, Worcester
- Michigan: Alpena, Detroit, Flint, Grand Rapids, Houghton Lake, Lansing, Marquette, Muskegon, Sault Ste. Marie
- Minnesota: Duluth, International Falls, Minneapolis-St. Paul, Rochester, Saint Cloud
- Mississippi: Jackson, Meridian, Tupelo
- Missouri: Columbia, Kansas City, Springfield, St. Louis
- Montana: Billings, Glasgow, Great Falls, Havre, Helena, Kalispell, Miles City, Missoula
- Nebraska: Grand Island, Lincoln, Norfolk, North Platte, Omaha, Scottsbluff, Valentine
- Nevada: Elko, Ely, Las Vegas, Reno, Winnemucca
- New Hampshire: Concord, Mount Washington summit
- New Jersey: Atlantic City, Newark
- New Mexico: Albuquerque, Clayton, Roswell
- New York: Albany, Binghamton, Buffalo, Islip, New York, Rochester, Syracuse
- North Carolina: Asheville, Cape Hatteras, Charlotte, Greensboro, Raleigh, Wilmington
- North Dakota: Bismarck, Fargo, Williston
- Ohio: Akron, Cincinnati, Cleveland, Columbus, Dayton, Mansfield, Toledo, Youngstown
- Oklahoma: Oklahoma City, Tulsa
- Oregon: Astoria, Burns, Eugene, Medford, Pendleton, Portland, Salem
- Pennsylvania: Allentown, Avoca, Erie, Harrisburg, Philadelphia, Pittsburgh, Williamsport
- Rhode Island: Providence
- South Carolina: Charleston, Columbia, Greenville
- South Dakota: Aberdeen, Huron, Rapid City, Sioux Falls
- Tennessee: Bristol-Johnson City, Chattanooga, Knoxville, Memphis, Nashville
- Texas: Abilene, Amarillo, Austin, Brownsville, Corpus Christi, Dallas-Ft. Worth, Del Rio, El Paso, Houston, Lubbock, Midland-Odessa, Port Arthur, San Angelo, San Antonio, Victoria, Waco, Wichita Falls
- Utah: Milford, Salt Lake City, Wendover
- Vermont: Burlington
- Virginia: Lynchburg, Norfolk, Richmond, Roanoke, Wallops Island
- Washington: Olympia, Quillayute, Seattle-Tacoma, Spokane, Yakima
- Washington, D.C.: Washington
- West Virginia: Beckley, Charleston, Elkins, Huntington, Parkersburg
- Wisconsin: Green Bay, La Crosse, Madison, Milwaukee
- Wyoming: Casper, Cheyenne, Lander, Sheridan
What isn't covered
The source tables list specific weather stations, not every town, so use the nearest city with a similar climate (a coastal city tells you little about the mountains two hours inland). U.S. territories (Puerto Rico and the Pacific islands in the source table) are not included on this site. The values are long-term averages from records before 1997 and describe wood under cover; a rain-soaked board or a board in an air-conditioned room will read differently, so a moisture meter is still the final word.
New to the subject? Start with why a 2x4 isn't 2 by 4: shrinkage from drying is part of the answer.
Sources
- USDA Forest Products Laboratory. 2010. Wood Handbook: Wood as an Engineering Material (FPL-GTR-190): Table 13-1 (outdoor EMC, U.S. cities), Table 13-2 and Figure 13-1 (recommended moisture content), Table 13-5 (shrinkage coefficients), Table 14-1 (decay resistance), Table 16-5 (exterior finishes)
- Simpson, W.T. 1998. Equilibrium moisture content of wood in outdoor locations in the United States and worldwide. Research Note FPL-RN-0268: Table 2 (262 U.S. locations; the 254 in the 50 states and D.C. are used here)
- How we got the numbers: the Handbook's Table 13-1 is text and was copied directly. Simpson's Table 2 is printed as a scanned image, so we transcribed it from a high-resolution render and read every value three independent ways (two separate text-recognition passes and a visual check); all three agreed on every value, and the cities that appear in both tables match exactly. Both tables were calculated by the Forest Products Laboratory from NOAA National Climatic Data Center humidity and temperature records (Comparative Climatic Data).